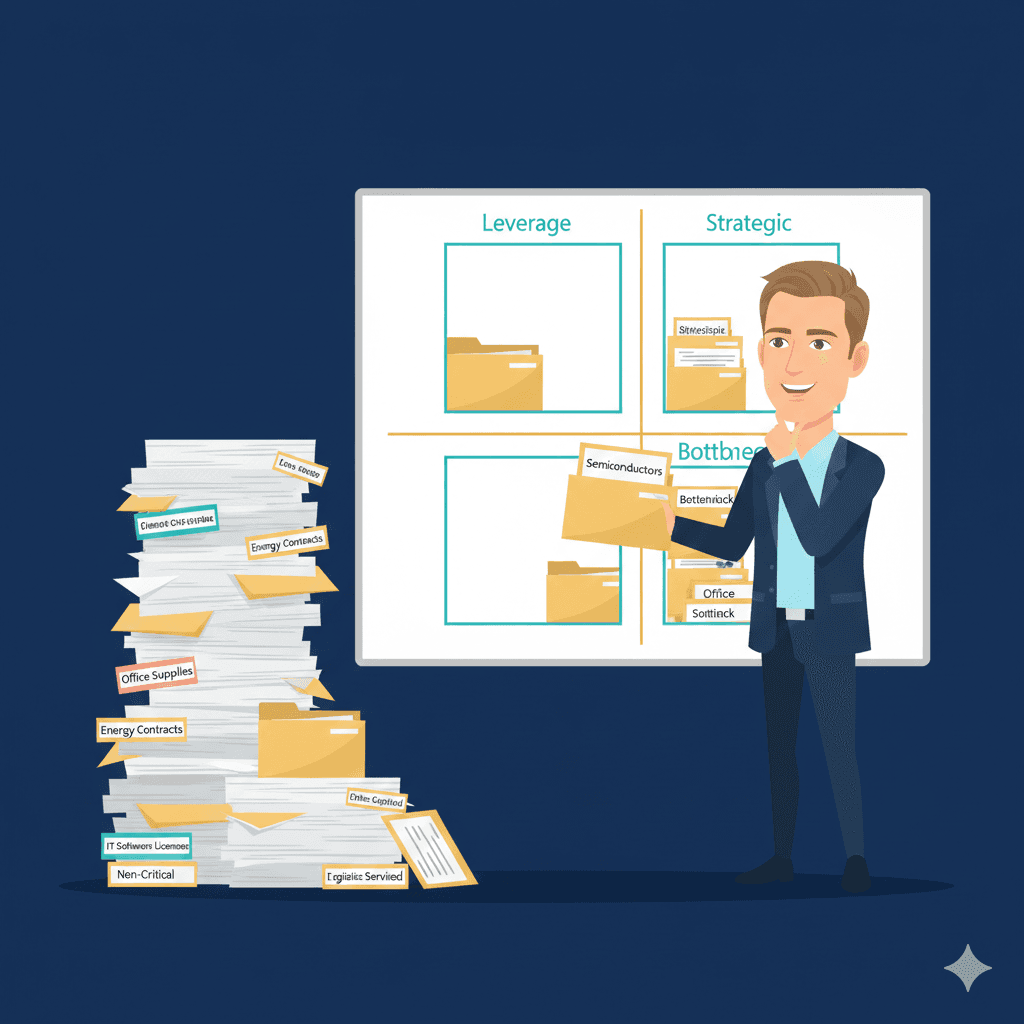
Kraljic Matrix : Stop treating all your categories the same way
Managing semiconductors like office supplies wastes time and savings. The Kraljic matrix tells you where to prioritise — and where to stop overinvesting.
On this page
- The origin and principle
- The two axes of the matrix
- Vertical axis: Impact on profit (Value)
- Horizontal axis: Supply risk
- The 4 quadrants in detail
- Non-Critical (Low impact, Low risk)
- Leverage (High impact, Low risk)
- Bottleneck (Low impact, High risk)
- Strategic (High impact, High risk)
- How to place your categories in the matrix
- The trap that costs dearly
- The 5 classic mistakes
- Kraljic's place in your complete framework
- In summary
- Next article in the series
Series · Tool #3 of 6 · Phase 1 — Strategic Analysis
Kraljic Matrix : Stop treating all your categories the same way
Managing office supplies like semiconductors is like using a hammer to screw. Inefficient, costly in time. The Kraljic matrix tells you where to prioritize and how.
● 14 min read● Tool #3 — Strategic Segmentation● Level : Junior → Expert
It's a question every category manager asks when they take over their portfolio: how do I prioritize my efforts? I have 50 categories, I only have one team. Should I treat pens like motors? Should I negotiate cleaning with the same intensity as critical sourcing?
The answer is no. And that's exactly what the Kraljic matrix tells you in 5 minutes.— Peter Kraljic, McKinsey, 1983
The Kraljic Matrix is the tool that changed modern procurement. Created 40 years ago, published in the Harvard Business Review, adopted by 99% of large companies. Why? Because it answers the fundamental question: what strategy for what category?
It's simple. It's powerful. And it works. This isn't corporate jargon — it's a decision grid that structures your resource allocation.
01
The origin and principle
Peter Kraljic was a consultant at McKinsey. In 1983, he asks a simple question: how should buyers allocate their resources rationally? The answer will be published in the Harvard Business Review and become an absolute classic.
The principle is radical in its simplicity: you don't need complex strategies. You need the right strategy for the right category. And that right strategy depends on only two variables:
- What is the financial impact of this category on your results?
- What is the supply risk if something goes wrong?
Cross these two axes, and you get four quadrants. Four strategies. End of story.
02
The two axes of the matrix
Vertical axis: Impact on profit (Value)
Measure: what percentage of COGS or total spend does this category represent? The key question: "If I reduce costs by 10% on this category, what is the P&L impact?"
For an SME with 10M€ revenue, 5% of spend = 500k€. For a large manufacturing company with 500M€ revenue, 5% = 25M€. It's relative, but it's easy to calculate from your Spend Analysis (you've already done it, right?).
Horizontal axis: Supply risk
Measure: how many alternative suppliers exist, and if my main supplier stopped tomorrow, what would be the operational impact? The key question: "How much time to find an alternative and produce again?"
Supply risk breaks down into 4 criteria. Score each from 1 to 10, then take the average:
Criteria | Low (1–3) | Medium (4–7) | High (8–10) |
|---|---|---|---|
Number of alternative suppliers | > 10 in the market | 3–10 alternatives | < 3 or monopoly |
Product complexity | Standardized, commodity | Partially custom | Highly specialized, proprietary |
Switching costs | < 1% of contract/yr | 1–5% of contract/yr | > 5% of contract/yr |
Replacement lead time | < 1 month | 1–3 months | > 3 months |
Risk isn't just "can this supplier let me down?". It's "if this supplier lets me down, how long is my supply chain paralyzed?".— Principle of modern Category Management
03
The 4 quadrants in detail
LOW IMPACT
Non-critical
- Office supplies
- Small equipment
- Cleaning
- Basic security
HIGH IMPACT
Leverage
- Energy
- Commodity materials
- Transport
- Telecom
Bottleneck
- Proprietary parts
- Niche software
- Mandatory certifications
- Ultra-specialized services
Strategic
- Semiconductors
- Pharma active ingredients
- ERP & Core IT
- Critical subcontracting
HIGH RISK
LOW RISK
You recognize your categories? Perfect. Now, here's how to manage each of these quadrants.
Quadrant 1
Non-Critical (Low impact, Low risk)
Office supplies, small equipment, standard consumables, cleaning, basic security
Strategy
SIMPLIFY — The goal isn't aggressive negotiation. It's to reduce transaction and administration costs to zero. Maximum automation.
Concrete tactics
- E-procurement with punchout catalog (1–2 suppliers max)
- Self-service procurement by end users
- Long-term contracts (3–5 years) without annual renegotiation
- RFP framework every 5 years
KPIs to track
- Catalog adoption rate > 90%
- Average transaction cost < 5€
- Processing time < 24h
Classic mistake
Spending 20 hours of buyer time negotiating 2% on pens, while leaving 30% in potential savings pending on strategic categories.
Quadrant 2
Leverage (High impact, Low risk)
Energy (liberalized market), commodity raw materials, transport & logistics, telecom, standard packaging, routine maintenance
Strategy
OPTIMIZE AGGRESSIVELY — The market is competitive, you have leverage. This is where good negotiation can create millions of euros.
Concrete tactics
- Rigorous RFx every 2–3 years with > 5 bidders
- Reverse auctions (e-auctions) when possible
- Volume consolidation (reduce supplier count)
- Short contracts (1–2 years) with annual review clauses
- Multi-sourcing (never 100% from one supplier)
Real quantified example
Transport category France, 15M€/year, highly competitive market → RFx every 3 years with 10 bidders → 12% savings on average = 1.8M€/year
KPIs to track
- Savings achieved : 5–15%/year
5 bidders per RFx
- Contract coverage : 100%
Classic mistake
Keeping the same supplier "because it's easier" for 5 years, and losing 8–10% in savings while watching competitors do better.
Quadrant 3
Bottleneck (Low impact, High risk)
Proprietary spare parts, niche software, proprietary components, mandatory certifications/audits, ultra-specialized technical services
Strategy
SECURE — Cheap in absolute value, but a disruption paralyzes everything. The goal: zero downtime, even at a high cost.
Concrete tactics
- Long-term contracts (3–5 years) with guaranteed availability
- Safety stock (3–6 months depending on criticality)
- Develop alternatives, even expensive ones
- Progressive standardization when possible
- Share demand forecasts with supplier
Real example
A proprietary part at a manufacturer, costs 500€, used 10 times/year = 5k€/year of spend. But if disruption, production stops = 100k€/day loss. You sign a 5-year contract without price reduction, you stock the parts, it pays for itself with any incident.
KPIs to track
- Service level : 100%
- Zero disruptions
- Lead time tracked monthly
- Number of alternatives identified > 0
Classic mistake
Neglecting Bottleneck categories because they're "small in value", then suffering a disruption that paralyzes production for 2 weeks and costs 10× the annual budget of the category.
Quadrant 4
Strategic (High impact, High risk)
Semiconductors, pharma active ingredients, ERP & Core IT, rare earths, externalized R&D, critical manufacturing subcontracting
Strategy
STRATEGIC PARTNERSHIP — You're not negotiating, you're co-developing. The goal: secure supply AND create value together.
Concrete tactics
- 5–10 year contracts with volume and innovation commitments
- Co-development of product and process
- Open-book costing (full cost transparency)
- Quarterly or monthly Steering Committees
- Early Supplier Involvement (involvement from design)
- Joint investments in R&D or equipment
Detailed real example
Cloud Infrastructure for a SaaS company (50M€/year spend, 30% of COGS) → 5-year contract with annual commitment, quarterly architecture review, early access to new services, co-development of features → Result: -20% cost over 3 years + 5 new features generated together
KPIs to track
- Innovations co-developed per year
- DPPM quality (defects per million)
- Total Cost of Ownership (vs base price)
- Strategic Alignment Score (mutual satisfaction)
Classic mistake
Trying to "push down prices" on an irreplaceable strategic supplier with the aggressive Leverage approach. You lose the partnership, and you have no alternative. Conversely, being too "nice" and letting margins spiral.
04
How to place your categories in the matrix
Theory is nice. But here's the step-by-step method to do it concretely.
1
List all your categories
Use your Spend Analysis result (Article #1). You should have 30–80 categories depending on company size. Don't forget services, maintenance work, external expenses, not just materials.
2
Score profit impact (vertical axis)
For each category, score from 1 (low) to 10 (high) based on: % of total spend × impact on results. Simple rule: over 10% of spend = score > 7. Less than 2% = score < 4.
3
Score supply risk (horizontal axis)
For each category, score the 4 criteria (alternative suppliers, complexity, switching costs, lead time) from 1 to 10, then take the average. Don't hesitate to talk to operations and engineering — they see risks you won't see alone.
4
Place each category on an X-Y graph
Impact on Y (vertical), Risk on X (horizontal). You naturally get 4 quadrants. Categories fall where they should, not where you think they are.
5
Validate with business stakeholders
The buyer alone can misjudge operational risk. Show the matrix to your Operations, Engineering, Production managers. They'll correct your risk on 30% of categories. That's normal and it's good — that's how you get it right.
05
The trap that costs dearly
Categories don't stay in the same quadrant. A "Leverage" commodity can become "Bottleneck" in 6 months during a supply crisis. Semiconductors in 2021? Moved from Strategic to Bottleneck for many industries.
The matrix must be updated at least annually. And mandatory during every major market shock: supply chain crisis, regulatory change, key supplier bankruptcy, geopolitical disruption.
Strategy evolves with position. If a category rises in impact (e.g., a raw material becomes critical due to inflation), you can't continue with the same buying approach you used when it was non-critical.
06
The 5 classic mistakes
07
Kraljic's place in your complete framework
If you've followed the series from the beginning, here's how all the tools feed each other:
🔗 The logical sequence
Spend Analysis → tells you how much you spend per category
Porter's Five Forces → tells you your overall negotiating position
Kraljic Matrix ← you are here → tells you how to segment to prioritize
Supplier Segmentation (Article #4) → tells you which suppliers to work with
Cost Breakdown / Should-Cost (Article #5) → gives you negotiation arguments
Category Strategy Canvas (Article #6) → synthesizes everything on 1 page
The Kraljic matrix is the bridge between analysis and execution. It tells you "here's how to prioritize" — and therefore where to deploy more detailed tools (Cost Breakdown, Supplier Segmentation, etc.).
Without Kraljic, you analyze everything the same way. With Kraljic, you analyze the categories that deserve it well, and you simplify the others. That's what makes the difference between a busy buyer and a productive category manager.— Fundamental principle of Category Management
In summary
The Kraljic matrix tells you what to prioritize and what strategy to apply. It's simple. It's powerful. And it's worked for 40 years.
- Non-Critical = Simplify (e-procurement, zero buyer time)
- Leverage = Optimize aggressively (RFx, auctions, 5–15% savings)
- Bottleneck = Secure (zero disruptions, stock, long-term contracts)
- Strategic = Strategic partnership (co-development, long-term, win-win)
- Update the matrix annually minimum
The next tool, Supplier Segmentation (Article #4), will tell you how to manage your supplier portfolio for each quadrant. But without Kraljic, you wouldn't know where to start.
Next article in the series
Article #4 : Supplier Segmentation — How to manage your supplier portfolio according to each category's strategy.
Liked this? The monthly newsletter goes deeper: one map, every first Tuesday.
The monthly map, every first Tuesday at 07:30. One-click unsubscribe.
First Tuesday of every month, 07:30 CET. One-click unsubscribe.
In this series
Cost Breakdown & Should-Cost : Negotiate with facts (not opinions)
Should-cost analysis separates buyers who accept price hikes from category managers who control them. The complete method — how to build, use, and defend it.
10 March 2026Next → · Procurement MasteryPorter's Five Forces : Understanding your negotiating power before you negotiate
Most buyers negotiate without knowing if they hold the power. Porter's Five Forces shows you where you actually stand — before you walk into the room.
10 March 2026From the same seriesThe 6 Essential Tools Every Category Manager should Master
The 6 tools every category manager must master — and the exact order to use them. The complete framework: spend analysis through to category strategy canvas.
10 March 2026