
Supplier Segmentation : How to move your suppliers from 500 to 80 (and save 30% of your time)
The difference between managing a chaotic supplier base and piloting a strategic portfolio — it’s the correct allocation of your resources.
How many active suppliers do you have in your ERP right now? Be honest. You probably have between 200 and 500. And now, the real question: how many do you actually know? Their performance, their financial risks, their innovation capabilities? If the honest answer is “the top 20, maybe”, you have a resource allocation problem.
Supplier Segmentation is not a database cleanup tool. It’s your supplier portfolio management strategy.— Fundamental principle of Category Management
The classic situation: you have 500 active suppliers, but 64% of them represent less than 2% of your total spend. These 320 suppliers consume 40% of your buyers’ administrative time. Meanwhile, the 12 strategic suppliers that represent 65% of your spend receive 15% of your attention. You’re managing the irrelevant.
Segmentation inverts this imbalance. It transforms your portfolio into a piloted strategic asset.
The real problem: managing the irrelevant
Here’s the snapshot of most organizations I meet:
- 500 active suppliers in the ERP
- 64% represent < 2% of total spend (320 suppliers for a minor share)
- These 320 suppliers = 40% of buyers’ admin time
- The 12 strategic ones = 65% of spend = 15% of attention received
- Zero visibility on financial risks or potential problems
The result: your procurement team spends 80% of its time on decisions that affect only 5% of your P&L, and just 20% on decisions that make up 65%.
It’s inverted workforce management. And it costs a lot.— Observable reality in 70% of mid-market organizations
Segmentation changes everything. It allows you to:
- Reduce your supplier base from 500 to 80-100 relevant suppliers
- Redirect 40% of buyer time towards strategic categories
- Generate savings: 12% on average via consolidation and renegotiation
- Reduce procurement administrative costs by 35%
- Lower risks: financial audit of strategic suppliers
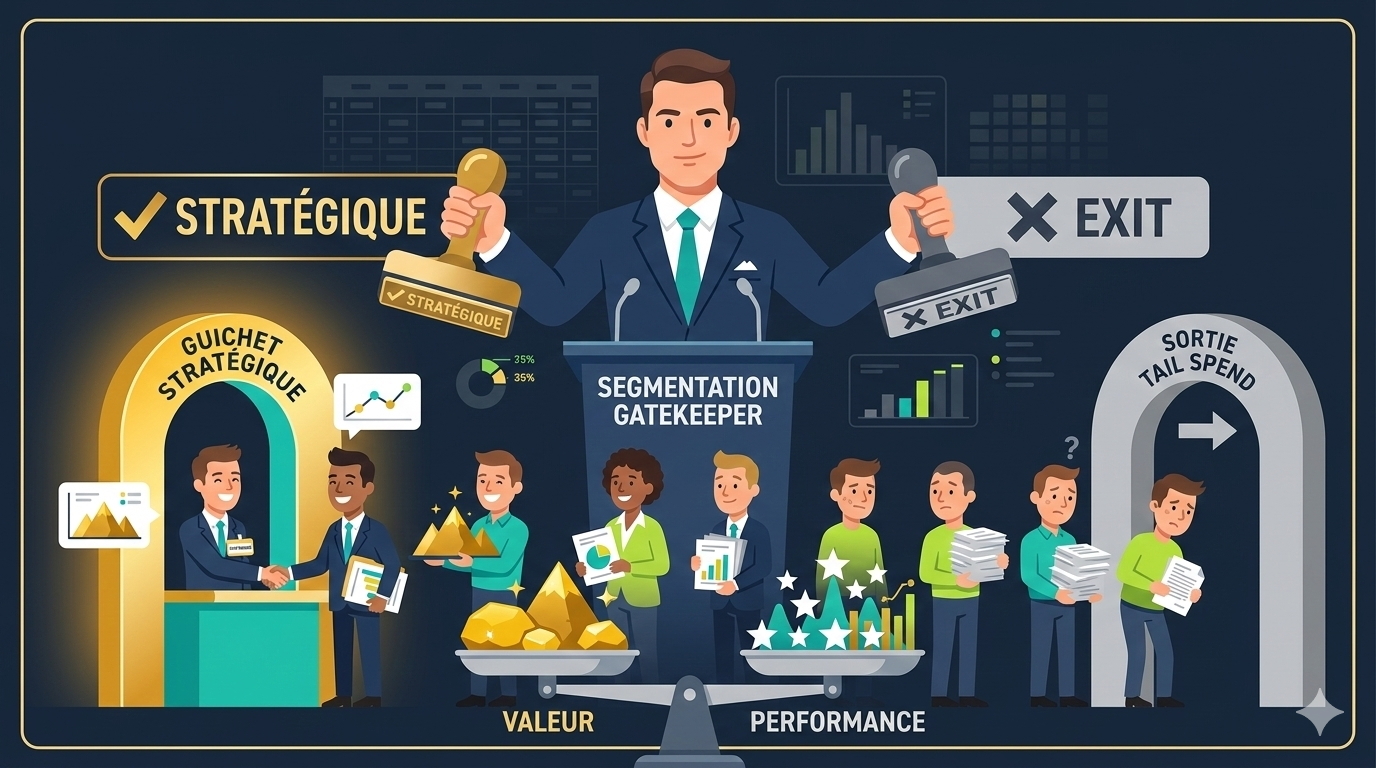
The 4 typical segments
Not all suppliers should be managed the same way. There are 4 clearly distinct segments, each with its own management logic. Here’s how to define and activate them.
Strategic
Preferred
Transactional
Phase-out
The 2×2 segmentation matrix
How do you concretely position your suppliers? Use a 2×2 matrix with:
- Y-axis (Strategic Value) : spend + Kraljic criticality + innovation potential
- X-axis (Performance) : quality + delivery + price + compliance + collaboration
High value / High perf
Develop the relationship
High value / Low perf
Invest to improve
Low value / High perf
Optimize costs
Low value / Low perf
Exit plan
The scoring method
Here’s how to objectively score each supplier. It’s quantifiable — not a feeling.
| Criterion | Weight | Calculation |
|---|---|---|
| STRATEGIC VALUE (0–100) | ||
| Annual spend | 40% | % of total spend × 100 |
| Kraljic criticality | 30% | Strategic=100, Lever=60, Bottleneck=70, Routine=20 |
| Innovation potential | 15% | Observed R&D capacity (0–100) |
| Replacement complexity | 15% | Lead time + costs to replace (0–100) |
| PERFORMANCE (0–100) | ||
| Quality | 30% | (100 − DPPM%/10) or defect rate |
| Delivery (OTD) | 25% | % On-Time Delivery × 100 |
| Price competitiveness | 20% | vs market benchmark (0–100) |
| Compliance | 15% | Signed contracts, certs, ESG (0–100) |
| Collaboration | 10% | Responsiveness, transparency, feedback (0–100) |
Apply this scoring to all your suppliers. Yes, it takes time the first time. But you have an objective, defensible segmentation with your management.
Practical case: the manufacturing company
Let’s say a real situation: a manufacturing company with 350 active suppliers, 8 buyers, 45M€ in external spend. Here’s how segmentation restructured them over 3 years.
Initial situation
| Segment | Number | % of total | Spend | % spend | Buyer time allocated |
|---|---|---|---|---|---|
| Strategic | 12 | 3% | €29.25M | 65% | 15% |
| Preferred | 35 | 10% | €11.25M | 25% | 20% |
| Transactional | 80 | 23% | €3.6M | 8% | 30% |
| Phase-out (tail spend) | 223 | 64% | €0.9M | 2% | 35% |
The diagnosis jumps out: 64% of suppliers (tail spend) represent 2% of spend but consume 35% of buyer time. That’s exactly the opposite of what you should be doing.
3-year action plan
Aggressive consolidation
Category rationalization
Optimization and stabilization
Results after 3 years
- −71% of supplier base (from 350 to 100)
- +40% of buyer time redirected to strategic suppliers
- 12% savings via consolidation and renegotiation
- −35% of admin costs for procurement (fewer POs, fewer invoices)
- Zero supplier bankruptcies (financial audit instituted)
- +3 new innovative contracts with strategic suppliers
Supplier Business Reviews (SBR): the engine of strategic suppliers
Once you’ve segmented, real management begins. For strategic suppliers, the key tool is the Supplier Business Review (SBR).
What is an SBR?
It’s a structured meeting with your strategic supplier, once per quarter, lasting 3 hours, that transforms a transactional relationship into a true partnership.
Typical format of a quarterly SBR
Review past performance (30 min)
Risk analysis (20 min)
Ongoing projects (40 min)
Innovation pipeline (30 min)
Next quarter action plan (40 min)
Typical participants: Category Manager, Procurement Director, operational representative (product/logistics), Supplier CEO/COO.
Strategic suppliers with regular SBRs perform on average 15–20% better on their KPIs than those without them. It’s the effect of shared attention.— Empirical data observed
Classic mistakes to avoid
Segment alone, without operations
Clean the database without a transition plan
Keep a “strategic” out of habit
Don’t update segmentation
Confuse exiting a supplier with killing it
Integration with the tool series
Supplier Segmentation doesn’t exist in isolation. It’s one of 6 tools — it draws from the others and feeds them.
If you haven’t done Spend Analysis, you segment on bad data. If you don’t have Kraljic, you don’t really know if a supplier is strategic or just high-volume. True power comes from using them together.
In summary
Supplier Segmentation transforms administrative chaos into piloted portfolio strategy. You move from “we manage 500 suppliers poorly” to “we manage 100 really well”.
- 4 distinct segments: Strategic, Preferred, Transactional, Phase-out
- 2×2 matrix to position: Strategic Value vs Performance
- Objective scoring: not a feeling, quantified data
- Effort reallocation: 40% buyer time gain
- SBR for strategic suppliers: transform relationships into partnerships
- 12% average savings via consolidation and renegotiation
The next step? Cost Breakdown (Article #5). Now that you’ve identified your real supplier challenges, you’ll learn how to negotiate them with factual weapons — not opinions.
Next article in the series
- Article #0 — Introduction · Roadmap
- Article #1 — Spend Analysis : Where does the money go?
- Article #2 — Porter’s Five Forces : What is your market position?
- Article #3 — Kraljic Matrix : Where to prioritize your efforts?
- Article #4 — Supplier Segmentation : How to manage your portfolio? ← You are here
- Article #5 — Cost Breakdown & Should-Cost : How to negotiate with facts?
- Article #6 — Category Strategy Canvas : What is your action plan?