
Spend Analysis : The foundation of every category strategy
Most category managers think they know their spend. Really. You have your SAP reports, your Ariba extractions, your monthly departure sheets. You have the numbers.
Except the reality is this: you’re underestimating your real spend by 20 to 40%. Shadow spending lingering on corporate cards. Decentralized purchases by business units directly from local suppliers. Tail spend hidden in 300 small suppliers. Expense reports that never make it back to the ERP. Unmatched POs hiding real purchases. And sometimes entire categories you “forget” because they’re not in the procurement budget.
You can’t optimize what you don’t measure. And you can’t negotiate effectively when you’re off on real volumes by 20%.— Principle #1 of Category Management
Spend Analysis is step zero. Not the attention-grabbing title of your category strategy, not the quick win, not the tool that shines. It’s the foundation on which every subsequent strategic decision rests. You get this wrong, everything that comes after collapses.
What is Spend Analysis?
Spend Analysis is a systematic and structured analysis of procurement spending. Its objective: answer one single question that determines everything. Where does the money go?
It works at three nested levels:
Descriptive level (What?)
Diagnostic level (Why?)
Predictive level (What if?)
Most analyses stop at level 1. They produce a report “we spend 47M€” with no action. The real work — the work that changes results — happens at levels 2 and 3.
The 6 key analysis dimensions
A Spend Analysis is only complete if it explores the 6 fundamental dimensions of your spending. Each one reveals different opportunities.
By category
By supplier
By Business Unit
By geography
Over time
By type of purchase
Each of these 6 dimensions generates different insights. Together, they create a 360° view of your procurement reality.
The 5 steps for a complete Spend Analysis
Step 1: Data collection
This is the foundation. Without complete data, everything collapses. Typical sources are:
- ERP (SAP, Oracle, IFS): raw extraction of invoices and payment entries
- P2P Modules (Ariba, Coupa): purchase orders, contracts, validations
- Corporate cards (American Express, Visa): decentralized purchases
- Expense reports: spending that bypasses formal procedures
- Off-ERP contracts: those you forgot or never entered
Critical timeframe: minimum 12 months, ideally 24-36 months to capture seasonal variations and see trends. A single quarter extraction is distortion.
Format: raw extraction with ALL relevant fields. Date, amount, supplier, category, Business Unit, cost center, purchase order number, currency. No pre-aggregation. Data cleaning is your job.
Step 2: Data cleaning
Essential operations:
- Supplier normalization: “IBM”, “IBM France”, “I.B.M. SARL” = single record in your database
- Deduplication: removal of duplicate entries
- Currency conversion: use the average rate for the period, not the day’s rate
- Scope exclusion: salaries, taxes, irrelevant purchases based on your scope
- Outlier correction: obviously wrong amounts to validate manually
Use Excel or a data cleaning tool (OpenRefine, Trifacta, or a Python script if you’re comfortable). Document each transformation. You’ll need to justify why you changed the data.
Step 3: Categorization
A recommended taxonomy on 3 levels:
- Level 1 (Category): IT, Marketing, Facilities, Maintenance, Production, Services, etc.
- Level 2 (Subcategory): IT Hardware, IT Software, IT Services
- Level 3 (Product/Service): Laptops, Servers, SaaS Licenses
Partial automation is possible with AI (classification algorithms on invoice descriptions), but manual validation is mandatory for all amounts > 100k€. Large amounts miscategorized skew everything.
Step 4: Analysis
Now that the data is clean, the analysis. Key calculations:
- 80/20 rule: 20% of suppliers represent what % of spend?
- Supplier concentration: Top 10 = ? % of total
- Maverick spend: % of off-contract purchases
- Tail spend: Number of suppliers < 10k€/year (warning: often 60-70% of total number, but 2-5% of spend)
- Contract coverage: % of spend covered by a formalized agreement
- YoY evolution: Growth or reduction in spend by category
These 6 metrics give you 80% of real understanding. Stop. Don’t get lost in 200 graphs.
Step 5: Actionable insights
Not an 80-slide report. Five priority opportunities with estimated impact in euros. One executive page for your director.
Format: Opportunity | Initial situation | Action | Potential savings | Timeline.
Typical opportunities revealed (with real numbers)
Here’s what we systematically find. The numbers are realistic and come from real consolidation projects.
| Opportunity | Initial situation | Typical action | Annual impact |
|---|---|---|---|
| Stationery supplier consolidation | 50 suppliers | Reduce to 3 national partners + volume commitment | -15% price + -60% admin |
| IT Software contract adoption | 40% of purchases off-contract | Framework agreement + negotiated price lists | -8% average cost |
| PC reference standardization | 250 different models | Reduce to 12 standard models + volume contract | -12% price + better support |
| Transport volume pooling | Purchased by decentralized BUs | Centralize ordering + group negotiation | -20% price |
| Tail spend rationalization | 68% of supplier count = 3% of spend | Integration into larger contracts or elimination | -40% administrative costs |
These opportunities aren’t “maybes”. These are patterns we find in 90% of companies. The question isn’t “will we have one?”, it’s “which one do we attack first?”
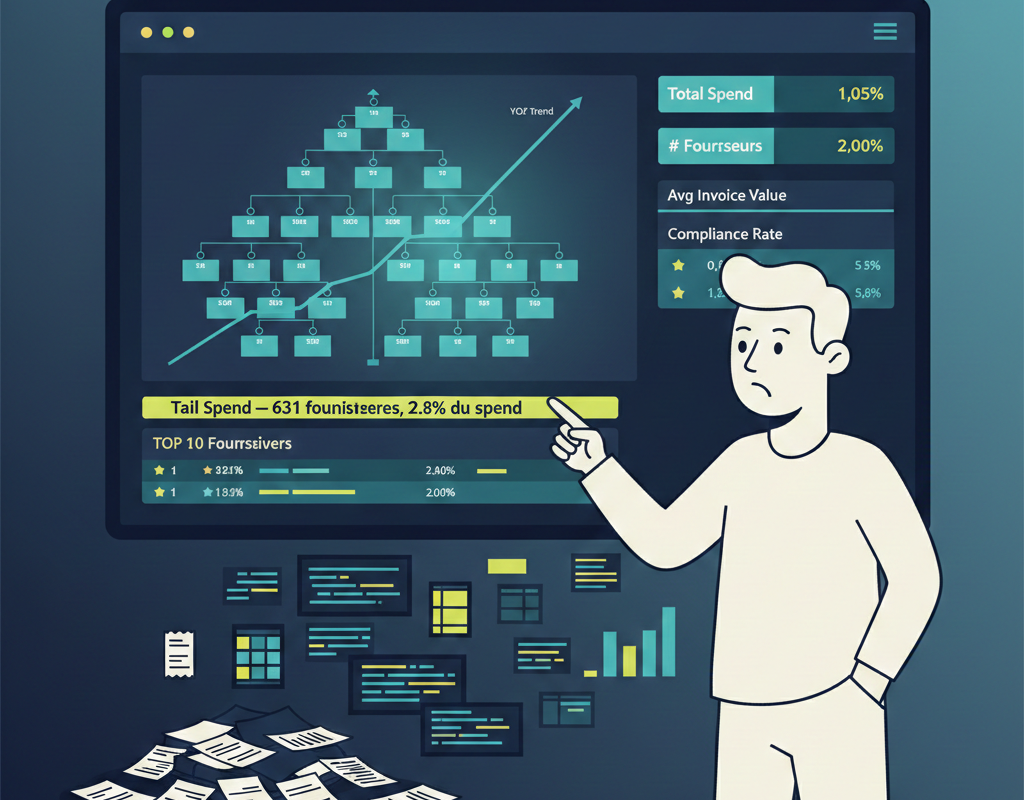
The Spend Analysis dashboard (what it must contain)
Forget 100-page reports. A good Spend Analysis dashboard contains exactly these KPIs. Nothing less, nothing more.
These 6 numbers are enough to guide 90% of your category strategy. Update the dashboard quarterly. Track trends.
Common mistakes (to absolutely avoid)
Analyzing too short a period
Ignoring tail spend because “it’s only 3% of spend”
Not validating with the business
Doing the analysis once and forgetting about it
Presenting raw data without insights
The place of Spend Analysis in your complete strategy
Spend Analysis alone changes nothing. It’s what you do with it that matters. Here’s how this tool feeds all your other category management tools:
Skipping Spend Analysis is building on sand. You analyze the wrong categories, you prioritize poorly, your strategy fails. All the following tools lose their relevance.
A good Spend Analysis prevents 10 bad strategies. It’s the cheapest investment you can make.— The Reality of Project Management in Procurement
In summary
Spend Analysis is the foundation. Here’s what it gives you:
- Visibility: you finally know where your money really goes (beyond what the ERP says)
- Fact-base: your category decisions rest on data, not impressions
- Opportunities: you systematically identify where to create leverage (consolidation, contracts, standardization)
- Baseline: a reference point to measure your savings in 6 months
- Alignment: you have shared numbers with the CFO, operations, and the business
Next time a supplier announces a price increase, you’ll have numbers. You’ll know exactly how much you buy from him per year, at what current price, with what alternatives, in what market context. And that changes everything in negotiation.
Now that you know where the money goes, the next step is understanding your negotiation position on each market. That’s the subject of Article #2: Porter’s Five Forces.
Next article in the series
- Article #0 — Introduction · Roadmap
- Article #1 — Spend Analysis: Where does the money go? ← You are here
- Article #2 — Porter’s Five Forces: What is your market position?
- Article #3 — Kraljic Matrix: Where should you prioritize your efforts?
- Article #4 — Supplier Segmentation: How do you manage your portfolio?
- Article #5 — Cost Breakdown & Should-Cost: How do you negotiate with facts?
- Article #6 — Category Strategy Canvas: What is your action plan?