Kraljic Matrix : Stop treating all your categories the same way
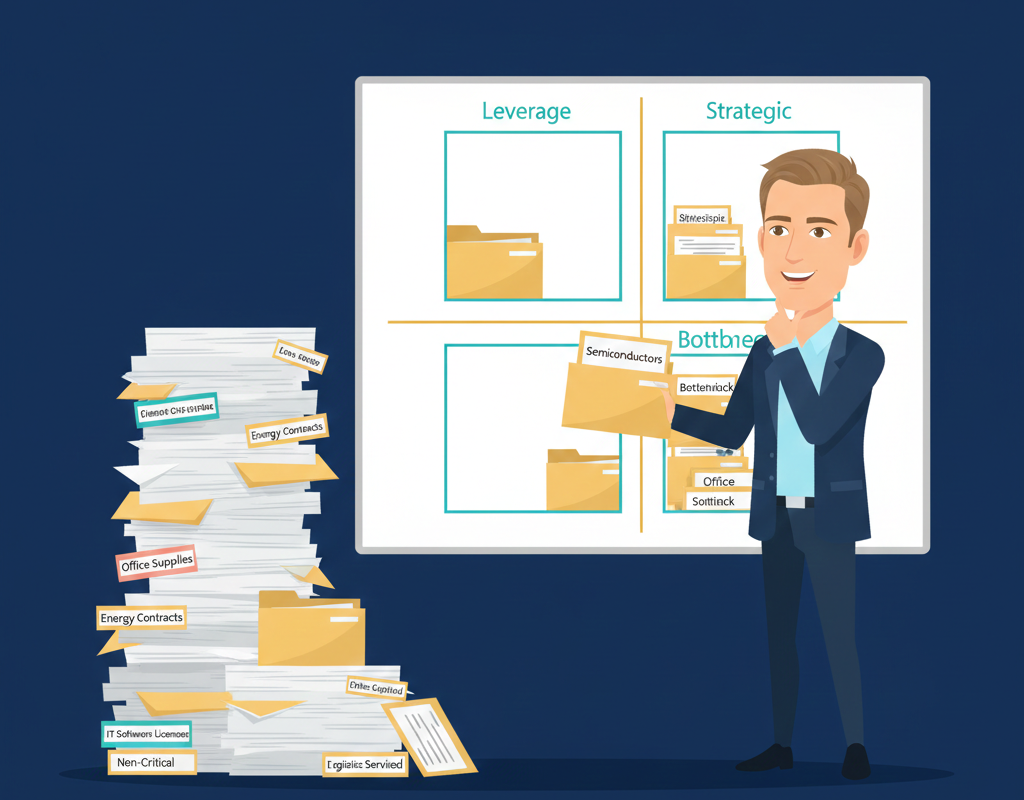
Managing office supplies like semiconductors is like using a hammer to screw. Inefficient, costly in time. The Kraljic matrix tells you where to prioritize and how.
It’s a question every category manager asks when they take over their portfolio: how do I prioritize my efforts? I have 50 categories, I only have one team. Should I treat pens like motors? Should I negotiate cleaning with the same intensity as critical sourcing?
The answer is no. And that’s exactly what the Kraljic matrix tells you in 5 minutes.— Peter Kraljic, McKinsey, 1983
The Kraljic Matrix is the tool that changed modern procurement. Created 40 years ago, published in the Harvard Business Review, adopted by 99% of large companies. Why? Because it answers the fundamental question: what strategy for what category?
It’s simple. It’s powerful. And it works. This isn’t corporate jargon — it’s a decision grid that structures your resource allocation.
The origin and principle
Peter Kraljic was a consultant at McKinsey. In 1983, he asks a simple question: how should buyers allocate their resources rationally? The answer will be published in the Harvard Business Review and become an absolute classic.
The principle is radical in its simplicity: you don’t need complex strategies. You need the right strategy for the right category. And that right strategy depends on only two variables:
- What is the financial impact of this category on your results?
- What is the supply risk if something goes wrong?
Cross these two axes, and you get four quadrants. Four strategies. End of story.
The two axes of the matrix
Vertical axis: Impact on profit (Value)
Measure: what percentage of COGS or total spend does this category represent? The key question: “If I reduce costs by 10% on this category, what is the P&L impact?”
- Low impact : < 2% of total spend
- Medium impact : 2–10% of spend
- High impact : > 10% of spend
For an SME with 10M€ revenue, 5% of spend = 500k€. For a large manufacturing company with 500M€ revenue, 5% = 25M€. It’s relative, but it’s easy to calculate from your Spend Analysis (you’ve already done it, right?).
Horizontal axis: Supply risk
Measure: how many alternative suppliers exist, and if my main supplier stopped tomorrow, what would be the operational impact? The key question: “How much time to find an alternative and produce again?”
Supply risk breaks down into 4 criteria. Score each from 1 to 10, then take the average:
| Criteria | Low (1–3) | Medium (4–7) | High (8–10) |
|---|---|---|---|
| Number of alternative suppliers | > 10 in the market | 3–10 alternatives | < 3 or monopoly |
| Product complexity | Standardized, commodity | Partially custom | Highly specialized, proprietary |
| Switching costs | < 1% of contract/yr | 1–5% of contract/yr | > 5% of contract/yr |
| Replacement lead time | < 1 month | 1–3 months | > 3 months |
Risk isn’t just “can this supplier let me down?”. It’s “if this supplier lets me down, how long is my supply chain paralyzed?”.— Principle of modern Category Management
The 4 quadrants in detail
- Office supplies
- Small equipment
- Cleaning
- Basic security
- Energy
- Commodity materials
- Transport
- Telecom
- Proprietary parts
- Niche software
- Mandatory certifications
- Ultra-specialized services
- Semiconductors
- Pharma active ingredients
- ERP & Core IT
- Critical subcontracting
You recognize your categories? Perfect. Now, here’s how to manage each of these quadrants.
Non-Critical (Low impact, Low risk)
- E-procurement with punchout catalog (1–2 suppliers max)
- Self-service procurement by end users
- Long-term contracts (3–5 years) without annual renegotiation
- RFP framework every 5 years
- Catalog adoption rate > 90%
- Average transaction cost < 5€
- Processing time < 24h
Leverage (High impact, Low risk)
- Rigorous RFx every 2–3 years with > 5 bidders
- Reverse auctions (e-auctions) when possible
- Volume consolidation (reduce supplier count)
- Short contracts (1–2 years) with annual review clauses
- Multi-sourcing (never 100% from one supplier)
- Savings achieved : 5–15%/year
- > 5 bidders per RFx
- Contract coverage : 100%
Bottleneck (Low impact, High risk)
- Long-term contracts (3–5 years) with guaranteed availability
- Safety stock (3–6 months depending on criticality)
- Develop alternatives, even expensive ones
- Progressive standardization when possible
- Share demand forecasts with supplier
- Service level : 100%
- Zero disruptions
- Lead time tracked monthly
- Number of alternatives identified > 0
Strategic (High impact, High risk)
- 5–10 year contracts with volume and innovation commitments
- Co-development of product and process
- Open-book costing (full cost transparency)
- Quarterly or monthly Steering Committees
- Early Supplier Involvement (involvement from design)
- Joint investments in R&D or equipment
- Innovations co-developed per year
- DPPM quality (defects per million)
- Total Cost of Ownership (vs base price)
- Strategic Alignment Score (mutual satisfaction)
How to place your categories in the matrix
Theory is nice. But here’s the step-by-step method to do it concretely.
List all your categories
Score profit impact (vertical axis)
Score supply risk (horizontal axis)
Place each category on an X-Y graph
Validate with business stakeholders
The trap that costs dearly
Categories don’t stay in the same quadrant. A “Leverage” commodity can become “Bottleneck” in 6 months during a supply crisis. Semiconductors in 2021? Moved from Strategic to Bottleneck for many industries.
The matrix must be updated at least annually. And mandatory during every major market shock: supply chain crisis, regulatory change, key supplier bankruptcy, geopolitical disruption.
Strategy evolves with position. If a category rises in impact (e.g., a raw material becomes critical due to inflation), you can’t continue with the same buying approach you used when it was non-critical.
The 5 classic mistakes
Never update the matrix (or update it too rarely)
Neglect Bottleneck categories
Apply the same approach to an entire quadrant
Do the analysis alone without operations
Confuse “I want a partnership” with “it’s a strategic category”
Kraljic’s place in your complete framework
If you’ve followed the series from the beginning, here’s how all the tools feed each other:
The Kraljic matrix is the bridge between analysis and execution. It tells you “here’s how to prioritize” — and therefore where to deploy more detailed tools (Cost Breakdown, Supplier Segmentation, etc.).
Without Kraljic, you analyze everything the same way. With Kraljic, you analyze the categories that deserve it well, and you simplify the others. That’s what makes the difference between a busy buyer and a productive category manager.— Fundamental principle of Category Management
In summary
The Kraljic matrix tells you what to prioritize and what strategy to apply. It’s simple. It’s powerful. And it’s worked for 40 years.
- Non-Critical = Simplify (e-procurement, zero buyer time)
- Leverage = Optimize aggressively (RFx, auctions, 5–15% savings)
- Bottleneck = Secure (zero disruptions, stock, long-term contracts)
- Strategic = Strategic partnership (co-development, long-term, win-win)
- Update the matrix annually minimum
The next tool, Supplier Segmentation (Article #4), will tell you how to manage your supplier portfolio for each quadrant. But without Kraljic, you wouldn’t know where to start.
Next article in the series
- Article #0 — Introduction · Roadmap
- Article #1 — Spend Analysis : Where does the money go?
- Article #2 — Porter’s Five Forces : What is your market position?
- Article #3 — Kraljic Matrix : Where to prioritize your efforts? ← You are here
- Article #4 — Supplier Segmentation : How to manage your portfolio?
- Article #5 — Cost Breakdown & Should-Cost : How to negotiate with facts?
- Article #6 — Category Strategy Canvas : What is your action plan?